
In the last tutorial I showed how you can collect old Tweets through the Premium API. The result was a jsonl-file which contains all the Tweets as json objects. This time we will create a gexf-file from those Tweets which you can use with Gephi or another network analysis tool.
1. Loading the Tweets from jsonl
There are different Python libraries that handle the loading of jsonl files. You could read the file line by line as well and just parse them with the json library, but where is the fun in that. I use json-lines, because it can handle gzipped as well as broken files. Others should be fine as well.
First we need to install it. If you use a Jupyter notebook !pip install json-lines, else just pip install json-lines.
You could read the whole Tweet objects into memory with the following code (don’t do it):
import json_lines

def load_jsonl(file):
    tweets = []
    with open(file, 'rb') as f:
        for tweet in json_lines.reader(f, broken=True):
            tweets.append(tweet)
    return (tweets)

tweets = load_jsonl('twitter_premium_api_demo.jsonl')
The Tweet objects contain a lot of information that we don’t need for the Retweet network. If you work with a small dataset that’s no problem, but the more Tweets you work with, the more RAM you need and everything becomes sluggish.
Instead we will read each Tweet, extract the data that’s relevant and toss the rest. Not literally, because it’s still in the file, but not in working memory.
I want the info when a Tweet was published and who published it (user_id, screen_name, join_date). If it is a Retweet, I want the same info about the account, that got retweeted. If you use a paid tier of the Premium API Twitter provides additional info about the account. From that I want the country and region, if it’s available. Put together we get this nice block of code.
import json_lines

def load_jsonl(file):
    tweets = []
    with open(file, 'rb') as f:
        for tweet in json_lines.reader(f, broken=True):
            reduced_tweet = {
                'created_at' : tweet['created_at'],
                'id' : tweet['id_str'],
                'username' : tweet['user']['screen_name'],
                'user_joined' : tweet['user']['created_at'][-4:],
                'user_id' : tweet['user']['id_str'],
            }

            if 'derived' in tweet['user']:
                reduced_tweet['country'] = tweet['user']['derived']['locations'][0]['country'] \
                if 'locations' in tweet['user']['derived'] else ""
                reduced_tweet['region'] = tweet['user']['derived']['locations'][0]['region'] \
                if 'region' in tweet['user']['derived']['locations'][0] else ""

            if 'retweeted_status' in tweet:
                reduced_tweet['retweeted_user'] = {
                    'user_id' : tweet['retweeted_status']['user']['id_str'],
                    'username' : tweet['retweeted_status']['user']['screen_name'],
                    'user_joined': tweet['retweeted_status']['user']['created_at'][-4:]
                }

            tweets.append(reduced_tweet)
    return (tweets)

tweets = load_jsonl('twitter_premium_api_demo.jsonl')
With len(tweets) we can find out how many Tweets we loaded and with tweets[0] we can look at what a single Tweet looks like now.
2. Creating a gexf network file
To be honest I don’t remember how I came to the current solution, but I struggled with gexf (GDF is easier to create, but more error prone and doesn’t support dynamic graphs). There is an example on the Gephi website and if I remember it correctly I used a file someone uploaded to a forum. In the end I used lxml to create the gexf, which is probably not the best solution, but it worked. At least with some hacking.
First you need lxml. !pip install lxml or without the exclamation mark, if you don’t use Juypiter notebooks.
The following code goes through each Tweet and creates a node for each user. If it is a Retweet it creates a node for the account that got retweeted as well and an edge between the two accounts. All nodes and edges have time attributes with the length of one second. I will write more about this in the last section. The edges go from the account that got retweeted to the account that retweets. In the past I often did it the other way around, but I argue that this is the correct way. The information flows from the account that published it, to the account the forwarded it. This is important to remember when doing any graph calculations. To get the account that got retweeted the most, you have to look at the one with the highest out-degree. If you want to change it, switch 'source' and 'target'.
import lxml.etree as etree
import datetime

def create_gexf(tweets, filename):
    attr_qname = etree.QName("http://www.w3.org/2001/XMLSchema-instance", "schemaLocation")

    gexf = etree.Element('gexf',
                         {attr_qname : 'http://www.gexf.net/1.3draft  http://www.gexf.net/1.3draft/gexf.xsd'},
                         nsmap={None : 'http://graphml.graphdrawing.org/xmlns/graphml'},
                         version = '1.3')

    graph = etree.SubElement(gexf,
                             'graph',
                             defaultedgetype = 'directed',
                             mode =  'dynamic',
                             timeformat='datetime')
    attributes = etree.SubElement(graph, 'attributes', {'class' : 'node', 'mode' : 'static'})
    etree.SubElement(attributes, 'attribute', {'id':'country', 'title':'country', 'type' : 'string'})
    etree.SubElement(attributes, 'attribute', {'id':'region', 'title':'region', 'type' : 'string'})
    etree.SubElement(attributes, 'attribute', {'id':'year', 'title':'year', 'type' : 'integer'})

    nodes = etree.SubElement(graph, 'nodes')
    edges = etree.SubElement(graph, 'edges')

    for tweet in reversed(tweets):
        node = etree.SubElement(nodes,
                                'node',
                                id = tweet['user_id'],
                                Label = tweet['username'],
                                start = datetime.datetime.strptime(tweet['created_at'],'%a %b %d %X %z %Y').isoformat(timespec='seconds'), #Fri Jul 27 07:52:57 +0000 2018
                                end = (datetime.datetime.strptime(tweet['created_at'],'%a %b %d %X %z %Y') + datetime.timedelta(seconds=1)).isoformat(timespec='seconds')
                               )
        attvalues = etree.SubElement(node,'attvalues')
        etree.SubElement(attvalues,
                         'attvalue',
                         {'for' : 'year',
                         'value' : tweet['user_joined']
                         }
                        )
        if 'region' in tweet:
            etree.SubElement(attvalues,
                             'attvalue',
                             {'for' : 'region',
                             'value' : tweet['region']
                             }
                            )
        if 'country' in tweet:
            etree.SubElement(attvalues,
                             'attvalue',
                             {'for' : 'country',
                             'value' : tweet['country']
                             }
                            )
        if 'retweeted_user' in tweet:
            etree.SubElement(edges,
                             'edge',
                             {'id' : tweet['id'],
                             'source' : tweet['retweeted_user']['user_id'],
                             'target' : tweet['user_id'],
                             'start' : datetime.datetime.strptime(tweet['created_at'],'%a %b %d %X %z %Y').isoformat(timespec='seconds'), #Fri Jul 27 07:52:57 +0000 2018
                             'end' : (datetime.datetime.strptime(tweet['created_at'],'%a %b %d %X %z %Y') + datetime.timedelta(seconds=1)).isoformat(timespec='seconds')
                             }
                            )
            node = etree.SubElement(nodes,
                                    'node',
                                    id = tweet['retweeted_user']['user_id'],
                                    Label = tweet['retweeted_user']['username'],
                                    start = datetime.datetime.strptime(tweet['created_at'],'%a %b %d %X %z %Y').isoformat(timespec='seconds'), #Fri Jul 27 07:52:57 +0000 2018
                                    end = (datetime.datetime.strptime(tweet['created_at'],'%a %b %d %X %z %Y') + datetime.timedelta(seconds=1)).isoformat(timespec='seconds')
                                   )
            attvalues = etree.SubElement(node,'attvalues')
            etree.SubElement(attvalues,
                             'attvalue',
                             {'for' : 'year',
                             'value' : tweet['retweeted_user']['user_joined']
                             }
                            )


    with open(filename, 'w', encoding='utf-8')as f:
        f.write(etree.tostring(gexf, encoding='utf8', method='xml').decode('utf-8'))
    print('Created gexf.')


create_gexf(tweets, 'demo_network.gexf')
I posted the complete script (the two parts you can see here as well) as a Github Gist for easier use. Instead of changing the input and output file within the code, in the Gist there are two constants at the top of the file.
After running the code, you will have a gexf file that you can open with Gephi.
3. Analyzing the dynamic Retweet network with Gephi
I wrote a tutorial about analyzing Twitter networks with Gephi in 2016. Most of the things didn’t change since then. Therefore I will only write about the things you should be aware when working with dynamic networks.
When you open the gexf file with Gephi, the import screen should say ‘Dynamic Graph’.

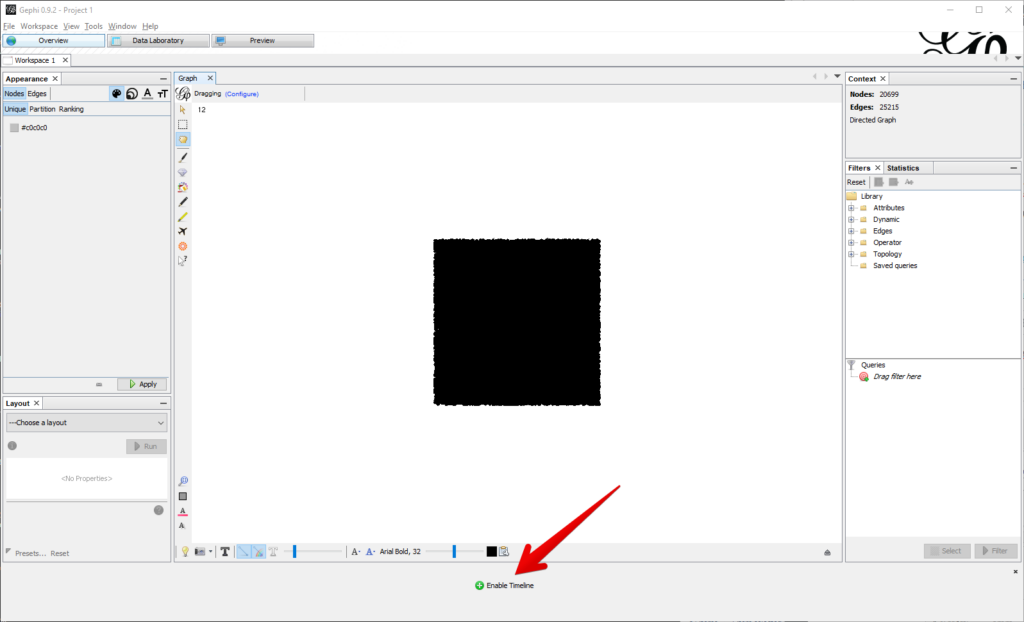
After pressing ‘OK’, you should see the typical glob of nodes, but there is a new interface element at the bottom of the screen. ‘Enable Timeline’. Click it to get the full power of the dynamic graph.
When you hover over the timeline, you will see the full datetime of the selected range. In my case from 2019-02-08 to 2019-02-13.

I made it my habit to change the selected time frame as soon as everything is fully loaded. This activates the Dynamic Range filter. When doing something else first, it sometimes doesn’t work any more later. I don’t know if there is a trick, but just changing it and setting it to full range again by double-clicking works for me.
After that you can do all the network analysis stuff you are used to do. Because of the many free floating nodes (accounts that tweeted about the topic, but weren’t retweeted), I like to use ForceAtlas2 with a Stronger Gravity selected and Gravity geared down to something like 0.05. This makes sure that the nodes don’t float away, but the core network is still interpretable. In the example I activated Prevent Overlap, set the color by country and size by out-degree (how many accounts retweeted an account).

With the little gear on the left side beside the timeline, you can set custom bounds to zoom into a smaller time frame. You can also set change the play settings for the play button on the left.

Let me know about your projects
I hope this tutorial helped you to get started with analyzing dynamic Tetweet networks. I would love to read about your projects in the comments or on Twitter.
Feel free to ask any questions. It sometimes takes some time until I can answer them, but I try to get back to everyone eventually.
Leave a Reply